Our attention span has decreased over time and now human beings have less attention span. When it comes to a website’s page speed, however, studies find slow websites are silent killers for businesses, as slow websites frustrate users and they are highly likely to switch to competitors if the websites that they are using are consistently slow to load, as they have no patience for slow websites. Businesses that fail to realize this can lose a lot of money after racking up negative reviews from customers.
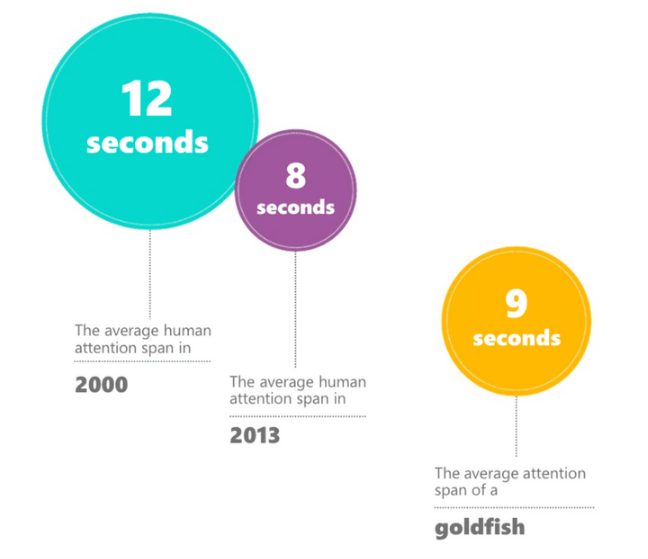
Image Credit: Brightwork Research and Analysis
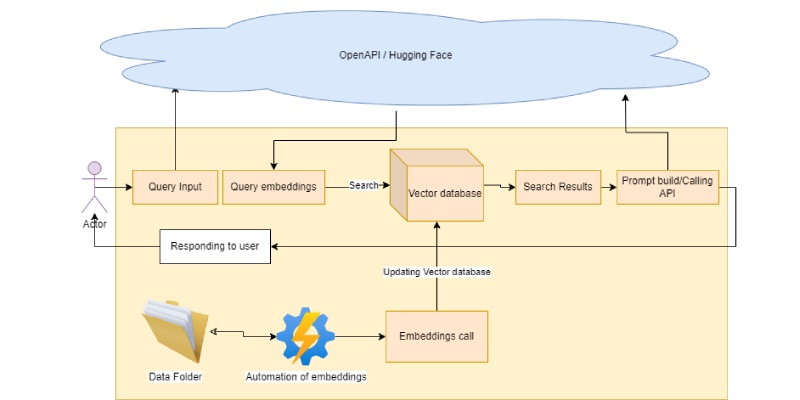
The advent and meteoric rise of Javascript-based frameworks & libraries, particularly the front runners Angular and React, means that more number of people/ organizations are gravitating towards web applications and not plain old websites. In such a scenario, the performance of these applications has taken a front seat as far as priorities go.
As testers, it is to make sure that the users’ experience is positive and ensure that the performance and user experience are not affected.
Performance testing is often done two ways: on the back end, and on the front end. You need to test that the servers can handle the load when multiple requests are sent from users simultaneously. If they can’t, users will get the dreaded 503 error. You can anticipate how your servers will respond using front-end load-testing tools such as JMeter, K6, or Gatling.
Back-end testing also has a lot of tools to help you test the performance of your website. One of the most popular is Google Lighthouse, an open-source tool developed by Google to audit the website manually and automatically.
Basically, Google Lighthouse is a tool that lets you audit your web application based on a number of parameters including (but not limited to) performance, based on a number of metrics, mobile compatibility, Progressive Web App (PWA) implementations, etc. All you have to do is run it on a page or pass it a URL, sit back for a couple of minutes and get a very elaborate report, not much short of one that a professional auditor would have compiled in about a week. By generating a Lighthouse report, you can assess any web page’s page experience and access valuable tips to improve its performance.
The best part is that you have to set up almost nothing to get started. In just a few clicks, you can get detailed page experience information, providing powerful insights into improving performance.
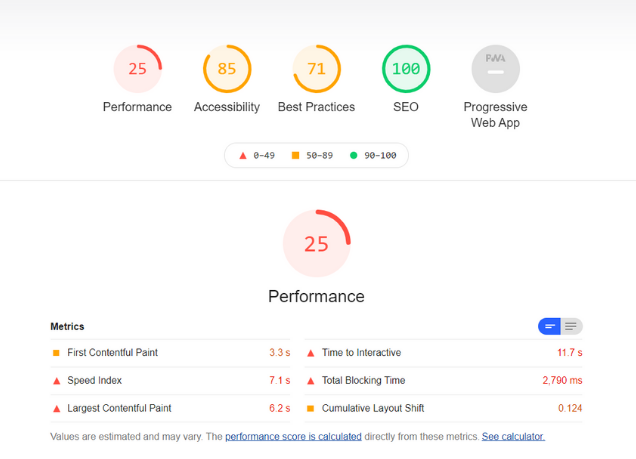
Google Lighthouse has the option of running the Audit for Desktop as well as the mobile version of your page(s). The top metrics that will be measured in the Audit are:
- Performance: This score is an aggregation of how the page fared in aspects such as (but not limited to) loading speed, time taken for loading for the basic frame(s), displaying meaningful content to the user, etc. To a layman, this score is indicative of how decently the site performs, with a score of 100 meaning that you figure in the 98th percentile, 50 meaning that you figure in the 75th percentile, and so on.
- PWA Score (Mobile): Thanks to the rise of Service Workers, app manifests, etc., a lot of modern web applications are moving towards the PWA paradigm, where the objective is to make the application behave as close as possible to native mobile applications. Scoring points are based on the Baseline PWA checklist laid down by Google which includes Service Worker implementation(s), viewport handling, offline functionality, performance in script-disabled environments, etc.
- Accessibility: As you might have guessed, this metric is a measure of how accessible your website is, across a plethora of accessibility features that can be implemented in your page (such as the ‘aria-’ attributes like aria-required, audio captions, button names, etc.). Unlike the other metrics though, Accessibility metrics score on a pass/fail basis i.e. if all possible elements of the page are not screen-reader friendly (HTML5 introduced features that would make pages easy to interpret for screen readers used by visually challenged people like tag names, tags such as
, , etc.), you get a 0 on that score. The aggregate of these scores is your Accessibility metric score. - Best Practices: As any developer would know, there are a number of practices that have been deemed ‘best’ based on empirical data. This metric is an aggregation of many such points, including but not limited to: Use of HTTPS, Avoiding the use of deprecated code elements like tags, directives, libraries, etc., Password input with paste-into disabled, Geo-Location, and cookie usage alerts on load, etc.
There are more than 75 metrics it tests and gives an overall scoring. The testers might be interested in some of the following popular ones as a site owner, SEO analyst, and webmaster.
One can find the complete list of scoring criteria for various metrics presented by Google Lighthouse here.
With a clear 1-100 grading system, Lighthouse allows you to audit your pages and find areas for improvement. You can expand each section to get in-depth insights and find places where you can quickly improve your page, as shown in the screenshot below.
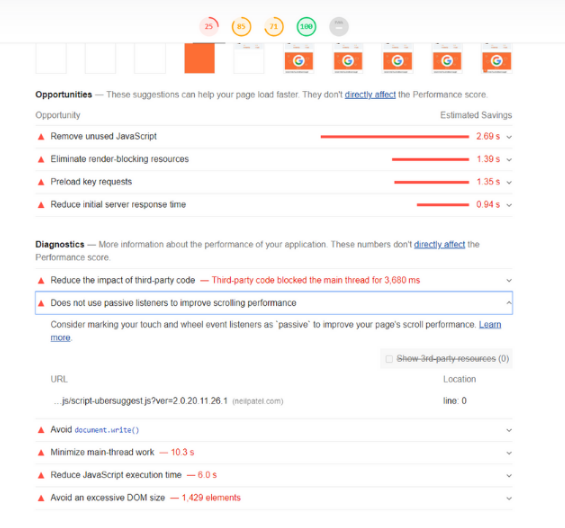
These metrics give you an idea of how fast your page loads and how quickly it is perceived to load. In other words, it’s not just about how quickly the entire page loads; it’s about the time it takes until the user can interact properly with it. This information is hugely important because perceived loading speeds make a big difference in how people interact with your website:
- 46 percent of people say waiting for pages to load is the worst part of their mobile browsing experience.
- The average mobile landing page takes 15.3 seconds to load.
- On average, people spend 70 percent longer on pages that load in five seconds.
- For every 100 milliseconds your site takes to load, your conversion rate can drop by 7 percent.
Google knows the majority of traffic comes from mobile devices, and it also knows that the majority of people don’t have access to super fast 4G or 5G. To simulate this, Google tests your web page by visiting your site through a suboptimal 3G connection on a slow device. If your site works well with a poor 3G connection, it will work well with the latest 5G connection. So, Google learns more about your site by testing it with the 3G connection. If this is how Google is judging your website, then it’s how you should be judging your website too—and this is why Google Lighthouse can be so helpful.